Why Seasonality Charts?
Have you ever wondered if buying stocks of an AC company like Voltas in winter and selling them in summer could be profitable? Or if umbrella companies make more profit during the monsoon season, leading to potential gains by buying in summer and selling during monsoon?
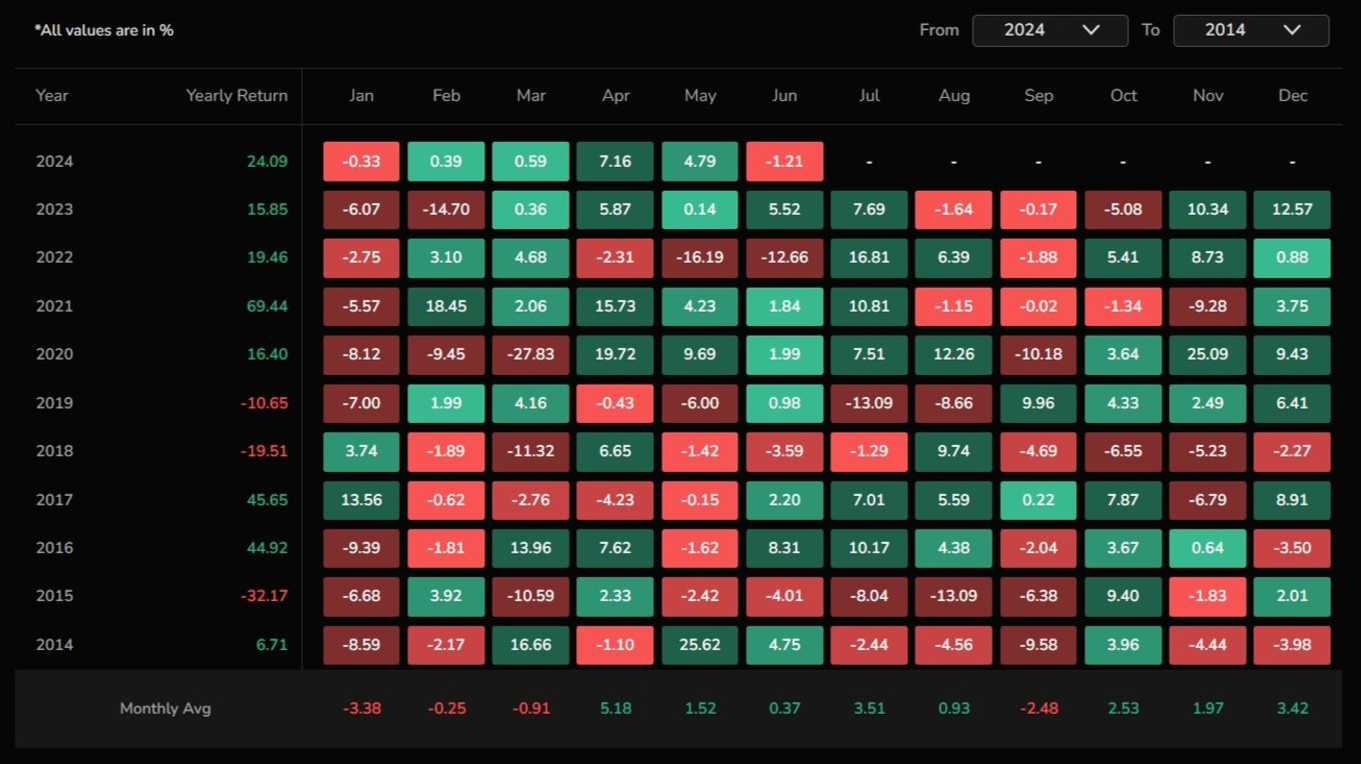
Seasonality chart is a useful tool in technical analysis, offering insights into recurring trends and patterns within financial markets. The seasonality chart from Tradejini provides valuable data on how the index has performed month-by-month over the past decade.
Seasonality chart
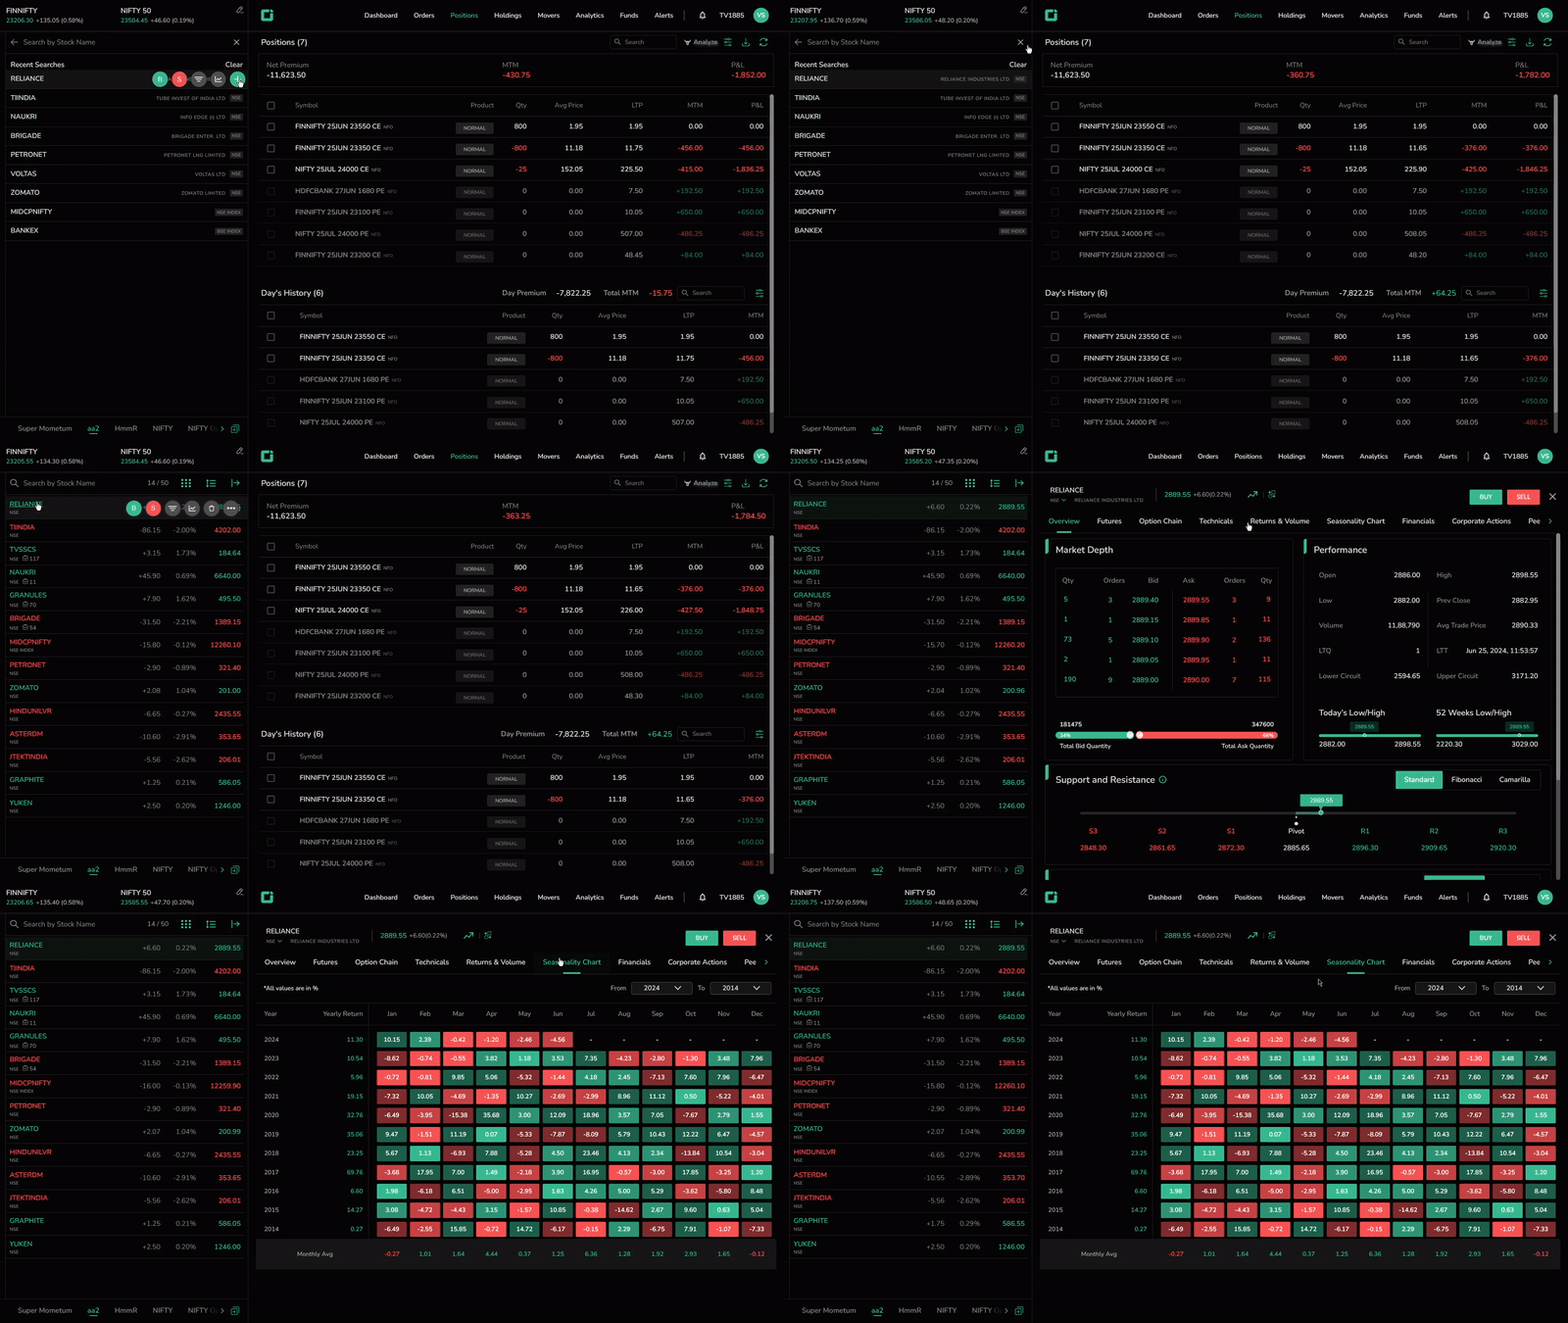
Where to find Seasonality Charts?

Why Consider Seasonality in Technical Analysis
- Predictive Insights: Seasonality charts reveal recurring patterns that can help predict future market behaviors. For instance, if a particular month has historically shown strong positive returns, traders might anticipate a similar trend in the future.
- Risk Management: Identifying periods of historically high volatility or downturns can help in formulating risk management strategies. Traders can adjust their positions or employ hedging strategies during these periods.
- Better Decision Making: Seasonality charts provide additional data points for making more informed trading decisions. When combined with other technical indicators, they offer a more comprehensive market analysis.
| ✋ Components of Seasonality Chart Asset Name Time Frame Monthly Returns Yearly Average Returns Monthly Averages |
| ✋ How a Seasonality Chart is Calculated Monthly Returns Calculation: For each month, the percentage change in the index is calculated from the previous month. Averaging: The average monthly return is computed for each month across all the years. This average represents the typical performance for that month. Visualization: The results are presented in a heatmap, with positive returns in green and negative returns in red, providing a visual representation of the index's seasonal performance. |
Ways to Use a Seasonality Chart

Confirmation of Trends: Use seasonality charts to confirm trends identified through other technical analysis methods. For example, if technical indicators suggest a bullish trend, a seasonality chart showing strong historical performance in the same period can reinforce the decision.
Strategic Entry and Exit

Seasonality charts can help identify optimal times to enter or exit positions. For example, in the above instance, January to March was bearish, and April to August was bullish. This suggests that a person could enter close to the end of March and exit close to the end of August.
Portfolio Management: Long-term investors can use seasonality charts to rebalance or hedge their portfolios. For example, with the above scenario, you can sell calls/buy puts against your main position to protect yourself from a potential downward move.
| Shortcomings to Keep in Mind Outliers and Anomalies: Significant events (e.g., economic crises, geopolitical events) can distort the data, leading to misleading trends. It's essential to consider such anomalies when analyzing seasonality charts. Changing Market Dynamics: The market environment is constantly evolving. Regulatory changes, technological advancements, and shifts in investor sentiment can all impact historical patterns. Over-reliance on Seasonality: seasonality should not be the sole basis for trading decisions. It is most effective when combined with technical and fundamental analysis tools. |
