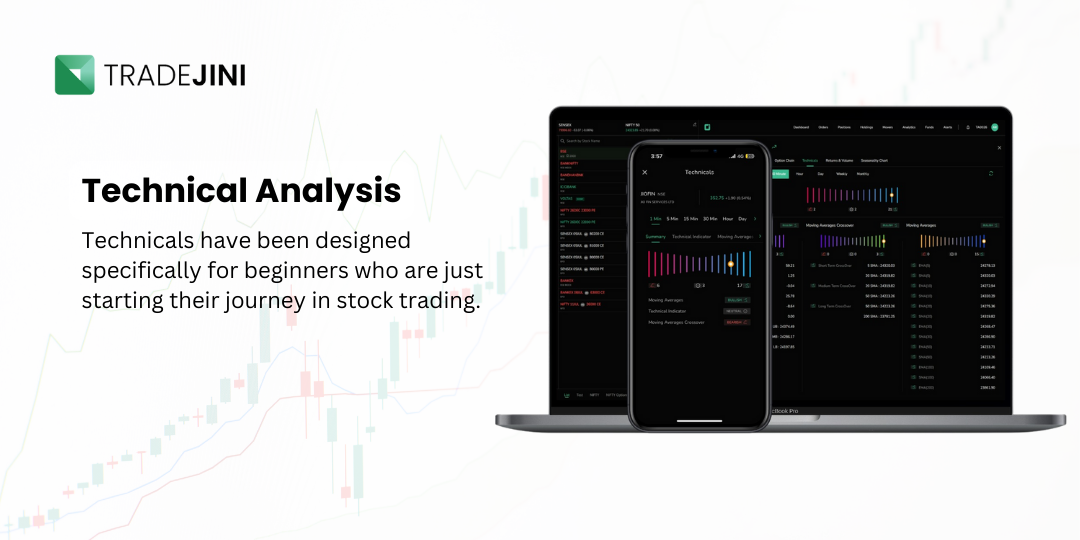
Technicals have been designed specifically for beginners who are just starting their journey in stock trading. Our platform includes a suite of technical analysis tools that are easy to understand and use, helping you make informed decisions and grow your trading skills. Let’s explore these features.
Multi-Time Frame Analysis

Understanding how stock prices change over different time periods is crucial for trading. Our platform offers multi-time frame analysis, allowing you to view price movements from as short as 1 minute to as long as a month.
- 1 Minute to 30 Minute Intervals:
- Perfect for day trading: Quickly see how prices are moving minute-by-minute or within half-hour segments.
- Easy to switch views: Helps you understand immediate market conditions and short-term trends.
- Hourly to Daily Intervals:
- Ideal for beginners: Observe how prices trend over a few hours to a day.
- Balanced view: Helps you spot patterns and make informed trading decisions.
- Weekly to Monthly Intervals:
- Long-term perspective: Understand broader market trends over weeks and months.
- Strategic insights: Useful for planning long-term investments.
Quick Summary See bullish (positive) or bearish (negative) signals at a glance. |
Essential Technical Indicators

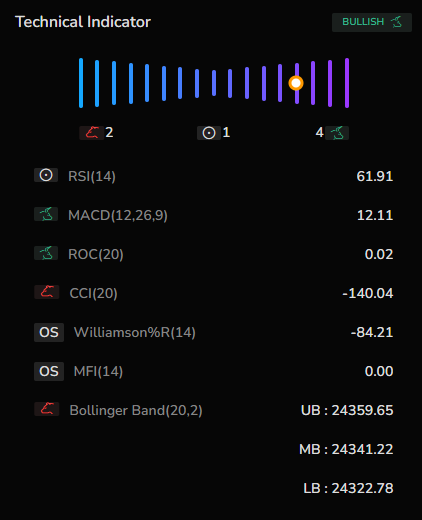
Our platform includes essential technical indicators that are straightforward and helpful for beginners:
- Relative Strength Index (RSI):
- Simple scale: RSI ranges from 0 to 100, indicating overbought (above 70) or oversold (below 30) conditions.
- Moving Average Convergence Divergence (MACD):
- Clear signals: Shows the difference between short-term and long-term moving averages.
- Trend identification: Helps you see if a stock is trending up or down.
- Rate of Change (ROC):
- Percentage change: Measures how much the stock price has changed over a period.
- Trend strength: Helps you gauge the speed of price movements.
- Commodity Channel Index (CCI):
- Simple comparison: Compares the current price to its average over a period.
- Identify cycles: Useful for spotting price highs and lows.
- Bollinger Bands:
- Bands show price volatility, making it easy to see when prices are higher or lower than average.
Moving Averages and Crossovers

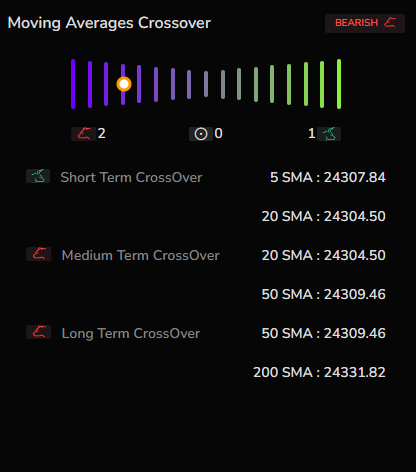
Moving averages help smooth out price data to show trends more clearly. Our platform includes various moving averages and crossovers:
- Short, Medium, and Long Term Moving Averages:
- Simple lines: Displayed as lines that smooth out daily price fluctuations.
- Trend clarity: Helps you see the overall direction of a stock's price.
- Crossover Signals:
- Easy signals: When a shorter moving average crosses a longer one, it indicates a potential trend change.
Learn more about Average Directional Index (ADX) Indicator and How To Use It For Day Trading on our blog.
