Maximizing Gains by Riding Trends with Darvas' Strategy
_10_11zon.webp?alt=media&token=3a898737-5b2c-4f6f-ae40-4ae91266c584)
In the fast-paced world of stock trading, many investors search for time-tested methods to guide their decisions. One such method, the Darvas Box Theory, might be less known to Indian traders but holds substantial potential for those who are keen on disciplined, momentum-driven strategies. Created in the 1950s by Nicolas Darvas, a professional dancer who turned an initial $10,000 into a staggering $2 million, this strategy combines simplicity with technical rigor. Let's dive into the core principles, how to apply it, and some nuances for the Indian market.
The Story Behind Darvas Box Theory
Nicolas Darvas wasn't a financial analyst. He was a dancer touring the world when he started dabbling in stocks. He had no access to live stock charts, yet by analyzing stock prices listed in publications like **The Wall Street Journal**, he created a strategy that relied purely on price movement and trading volume—no fancy tools or insider tips. His disciplined approach and systematic strategy enabled him to succeed in a challenging market environment.
This theory gained popularity after Darvas penned his journey in "How I Made $2,000,000 in the Stock Market." For Indian investors, understanding Darvas’ rules can add structure to trading approaches, especially when used with modern charting and data analysis tools.
Understanding the Darvas Box Theory
The essence of Darvas Box Theory is to capture momentum—a trend-following approach that assumes that stocks trading at new highs are likely to continue rising. Here's a simplified breakdown of the theory:
-
Box Formation: The Darvas Box is a range defined by the stock’s recent highs and lows. If a stock stays within this range, it's "boxed." A breakout above the box signals a buying opportunity, while a break below it indicates it might be time to sell.
-
Volume Confirmation: Volume plays a pivotal role in the Darvas Box Theory. Darvas believed that if a breakout is accompanied by a surge in volume, it indicates genuine interest from institutional buyers. For Indian markets, where retail investors are numerous, high volume can signal robust market interest, potentially making the breakout more reliable.
-
Trend Riding: Once a stock breaks out and enters a new box, the previous box's high serves as a support level. If the stock continues rising, a new box can be created, and the trailing stop-loss should be adjusted accordingly. In essence, you ride the trend as long as the stock is forming higher boxes.
-
Strict Stop-Loss Management: Darvas box strategy was meticulous about setting and following stop-loss orders. If the stock price fell below the lower boundary of the box, he would exit his position to prevent significant losses.
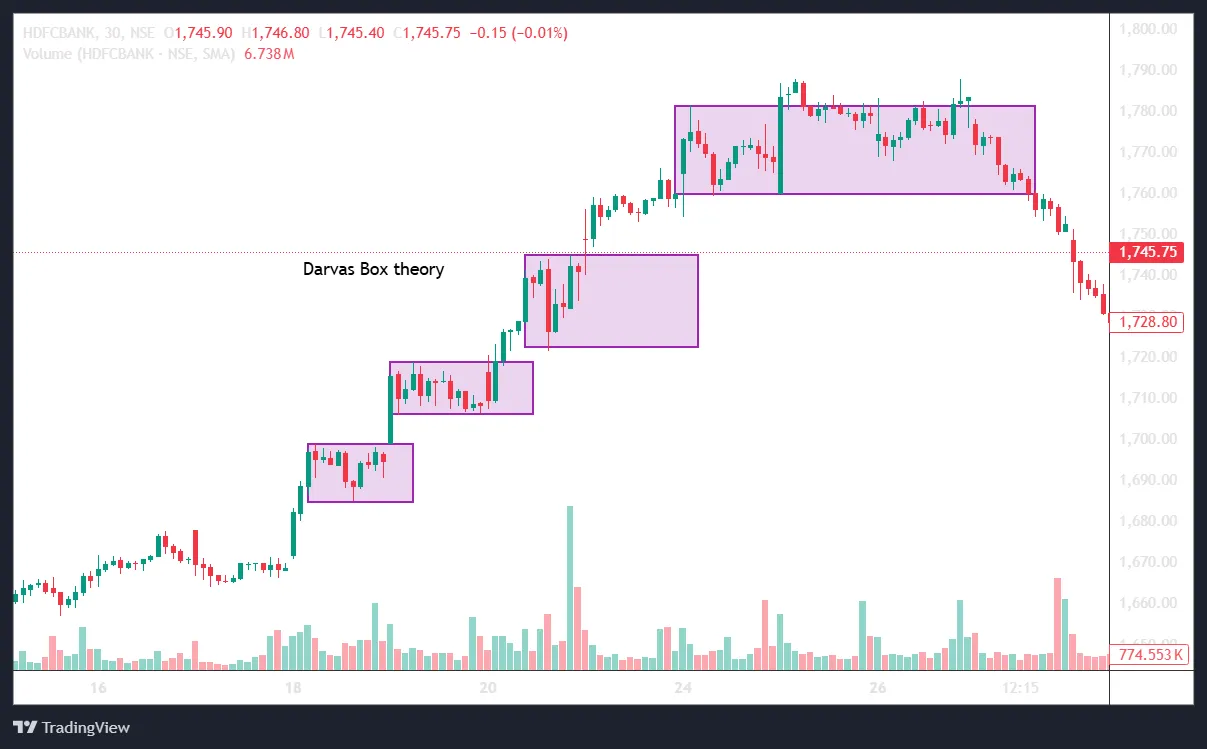
Let us see chart below of Daravas BOX theory-
Applying Darvas Box Theory in the Indian Market
While Darvas developed his strategy in the U.S. stock market, Indian investors can adapt it effectively. Here’s how:
-
Focus on Volume: Indian stocks with high institutional or Foreign Portfolio Investment (FPI) interest often see notable price trends. Sectors like banking, technology, and renewable energy can showcase strong volume trends during bullish cycles, making them ideal for a Darvas-style analysis.
-
Sector Selection: Darvas theory preferred industries with growth potential, and Indian investors can follow a similar approach. Fast-growing sectors like fintech, electric vehicles, and pharmaceuticals often outshine the broader market. Identify stocks within these sectors with a history of high trading volume and clear box formations.
-
Avoiding Sideways Markets: Darvas Box Theory performs best in trending markets. Since many critics argue it’s challenging in bearish or sideways markets, Indian traders should use this strategy when the Nifty or Sensex shows clear upward trends. Trying to apply this strategy in flat markets can lead to more frequent stop-loss triggers.
Application of Darvas box theory:
Steps for Entering and Managing Trades with Darvas Box Theory
-
Identify a Potential Stock with Strong Momentum:
Look for stocks that are already showing upward momentum and have high trading volume. This indicates interest from other traders and the potential for further price movement.
-
Form the Initial Darvas Box:
Track the recent price highs and lows.
Once the stock price reaches a new high and then retreats to a nearby range (without falling significantly below), mark this high and low as the top and bottom of the first Darvas box.
-
Confirm the Range:
Ensure that the price trades within this box (between the high and low) for a while.
This box formation indicates consolidation and signals a potential breakout opportunity.
-
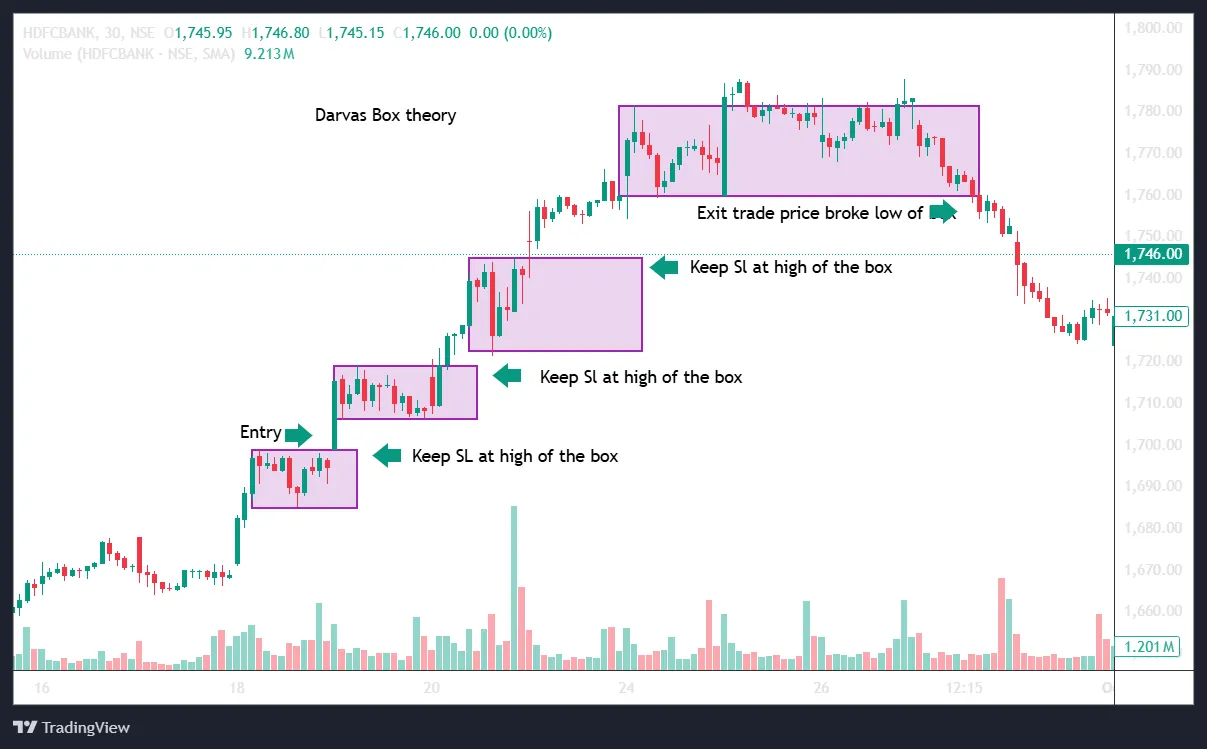
Enter the Trade on Breakout:
When the price breaks above the top of the Darvas box (the previous high) with good volume, enter a long (buy) position.
Set a stop-loss at the bottom of the Darvas box (the previous low). This will protect against downside risk if the breakout fails.
-
Form a New Box if Consolidation Occurs:
If the stock continues to rise and then starts trading in a new range, create a new Darvas box around the updated high and low levels.
This new box now becomes your updated trailing box.
-
Adjust Stop-Loss with Each New Box:
Move your stop-loss to the low of each new Darvas box as the stock creates higher highs and higher lows.
This trailing stop-loss technique helps lock in profits while allowing the stock to continue its upward trend.
-
Repeat with Each Breakout:
For each subsequent breakout, repeat the process of forming a new box and adjusting the stop-loss.
Continue until the stock price eventually breaks below the low of a Darvas box.
-
Exit the Trade:
Exit the trade when the price falls below the low of the current trailing box.
This signals the end of the trend, allowing you to lock in profits and protect against further losses.
Application of Darvas box theory using 50 EMA (Exponantial moving average)
Combining the Darvas Box theory with the 50-day Exponential Moving Average (EMA) can make your trading strategy more effective. When you use multiple indicators together, it increases your chances of identifying strong trade setups and reduces false signals.
With the Darvas Box, price movements within a defined "box" can indicate potential breakout or breakdown levels. By adding the 50 EMA, you gain an extra layer of confirmation—helping you gauge the strength of the trend and make better-informed decisions. This approach aligns the box strategy with a trend indicator, improving the probability of success in trades.
-
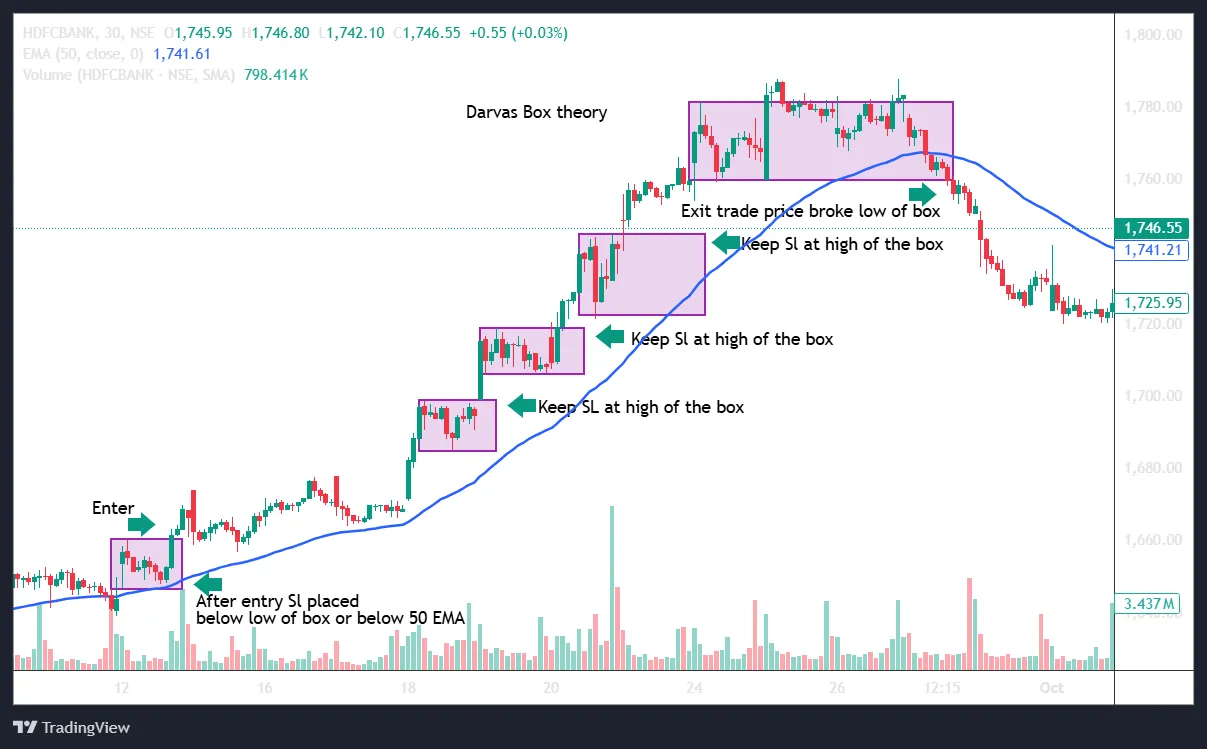
Identify the Uptrend: Start by watching for an uptrend where prices move above the 50-day Exponential Moving Average (EMA). This signals that the stock has upward momentum.
-
Wait for the Box Formation: Once the price is above the 50 EMA, be patient and wait for a "box" to form. This box will define the current range where prices are consolidating.
-
Look for a Breakout: When the price breaks out of the upper boundary of the box with strong volume, this is your entry signal. Enter the trade at this point.
-
Set a Trailing Stop Loss: Use the bottom line of the box as your initial stop loss. As the price rises, trail your stop loss upward to lock in gains. Continue to adjust your stop loss with each new box formation to maximize potential profits.
-
Target: When a new box forms, book some profits and adjust your trailing stop loss to the top of the previous box. Continue to repeat this strategy until the price breaks out of the new box.
Identification of false breakout:
As traders, we often encounter false breakouts—situations where a price appears to break out of a trading range but quickly reverses, leaving traders in a potential trap. Staying alert and avoiding impulsive trades in these scenarios is essential.
Using the Darvas Box theory with a 50-day Exponential Moving Average (EMA) can help. In this approach, when the price initially rises above the 50 EMA and forms an upper boundary within the box, it may look like a breakout. However, if the price falls back below the 50 EMA but still closes within the box, it signals caution. In such cases, avoid entering a sell trade just because the price dipped below the box but didnt close beow box, so it’s likely a false breakout. Instead, wait for a confirmed close outside the box to avoid making a wrong entry.
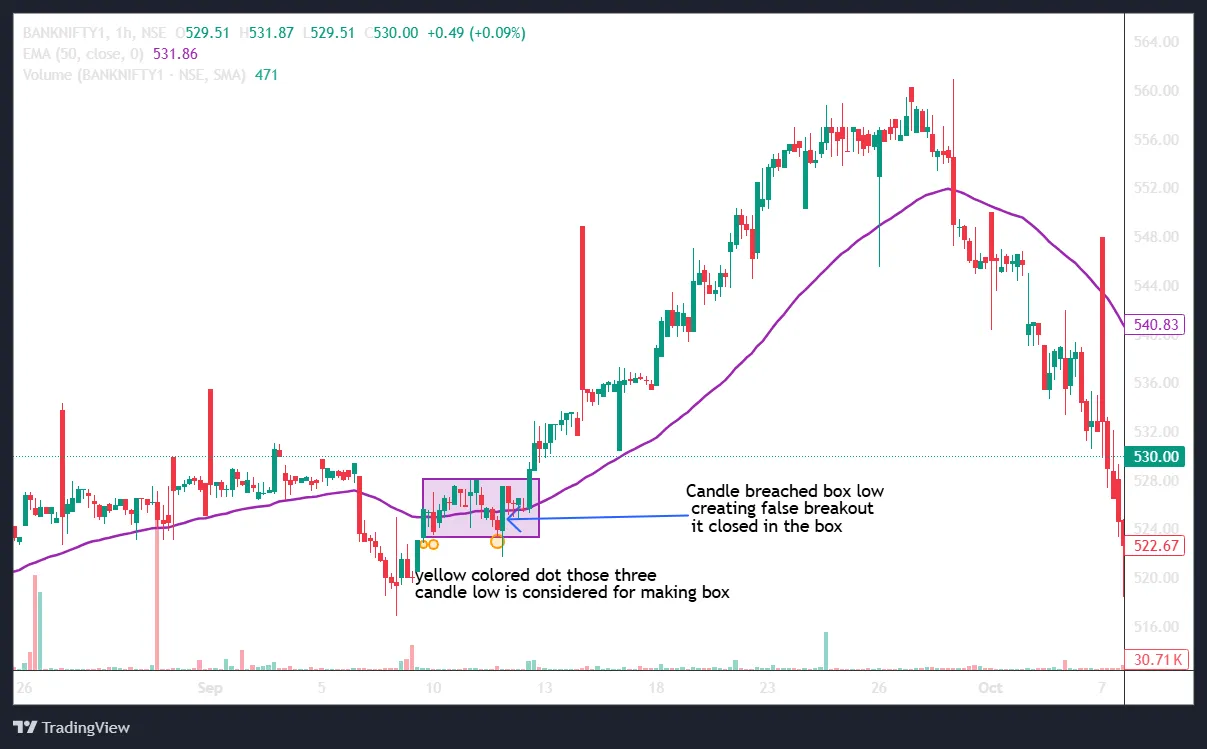
This disciplined approach can save traders from common traps and improve decision-making around potential breakout trades.
Potential Drawbacks and Considerations
While the Darvas Box Theory offers a straightforward framework, it’s important to remember some limitations:
-
Requires Patience and Discipline: Darvas stressed discipline, especially in sticking to stop-losses. This approach requires traders to have a clear strategy and the patience to wait for the right setups.
-
Works Best in Bullish Markets: As mentioned, Darvas Box Theory shines in bull markets. In bearish conditions, false breakouts can occur frequently, which may lead to stop-loss triggers and, ultimately, losses.
-
Not for Intraday Trading: Darvas focused on medium-to-long-term trends rather than quick trades. For Indian traders interested in intraday trading, this approach may not be suitable.
The Power of Patience and Precision in Trend Trading
The Darvas Box Theory is more than just a momentum-based strategy—it is a disciplined framework for identifying trends and managing risks effectively. By combining price action, volume confirmation, and strict stop-loss management, traders can capture high-probability setups while avoiding common pitfalls. When applied alongside modern tools like the 50 EMA, this approach becomes even more powerful, offering Indian investors a structured pathway to navigate dynamic market conditions with confidence.


.webp?alt=media&token=3f5e39cf-1437-44ef-b9f0-929208da9245)